States across the country are scrambling to reach lofty waste diversion rates in response to an EPA call to action to do so. They are setting specific diversion-from-landfill targets and developing calculated waste management practices to reach their end goals. But there's one big problem: many may not know where they’re starting from.
Numbers identifying landfilled waste vary radically depending on where those stats come from. But no matter whose numbers you look at, a common industry consensus is that the EPA’s figures are off—by a good bit. Debra Kantner, an environmental engineer at the Environmental Research and Education Fund (EREF), said, "We see real-life scenarios where states are using the underestimated EPA figures to inform their waste management decisions."
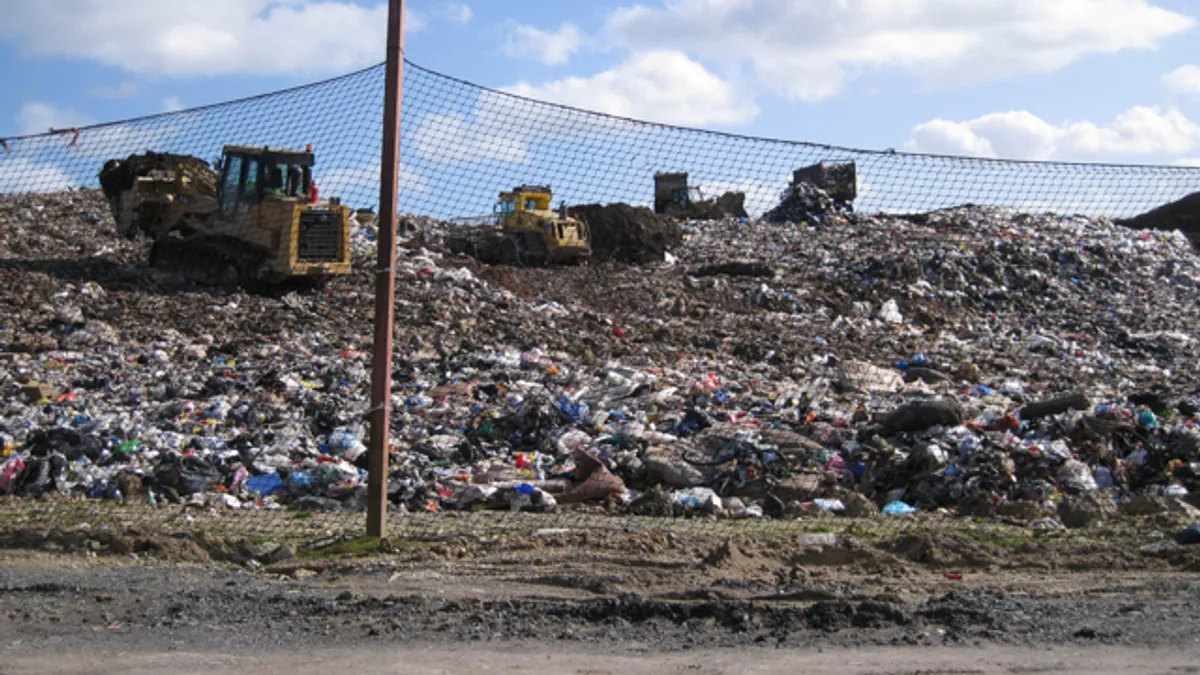
A Columbia University study published in BioCycle reported 269.8 million tons of MSW were landfilled in 2011, while EPA estimates were 132.4 million tons—a gaping 103% difference.
The numbers challenge is further complicated by an evolving industry trend to factor in not just landfilled waste figures, but environmental impact. This impact is generally measured as carbon output—the waste that comes largely from landfill gas (LFG) emissions. Again, the figures are all over the map. The Intergovernmental Panel on Climate Change (IPCC) said some regions capture only 20% of LFG during the site’s lifetime; the EPA has said 60% to 95%, according to Peter Anderson, president of Recycle Worlds Consulting.
Why is there such a huge numbers discrepancy?
"The reason for [EPA’s] underestimate [at least with landfilled waste numbers] comes down to methodology," said Kantner. The agency looks at materials produced nationwide, determines what is imported and exported, and then tries to assess what’s discarded and recycled, among other metrics.
But, said Kantner, "If we went to every MSW landfill and asked, 'How much did you bury?,' the figures are higher than what EPA says goes to landfill."
Even the numbers reported in BioCycle are a little high, according to an EREF study, though EPA’s estimates are still about 88 million tons a year below EREF’s calculation of 221.8 million tons in 2013.
The problem is there is no apples-to-apples comparison, or rather no MSW-to-MSW comparison. The BioCycle figures are higher because researchers were counting non-MSW in the mix, said Kantner. EREF took a step back and separated out, for instance, construction and demolition debris (C&D) from MSW.
"So we’re getting more accurate estimates. And we’re matching it back to EPA’s definition of MSW," said Kantner.
Trying to determine landfill gas emissions and their capture can be trickier yet, thus explaining the roughly 40%-75% difference between EPA’s claims and the IPCC’s on LFG capture. Some environmentalists say even if IPCC’s concerningly low 20% applies only to the stinkiest, gassiest landfills, the agency’s calculations are not even close.
The anomaly is tied mainly to the timing of EPA’s monitoring, or so says Anderson.
"EPA’s numbers showing fairly efficient gas capture generally pertain to when you have just shut down the landfill and the site is covered. There is still moisture and [resulting] gas. But this is a relatively short window. Most of the gas is generated before it’s capped and, later, after the cap fails—and unmaintained, it will eventually fail," he said to Waste Dive. Maintenance stops at 30 years and he said research shows substantially more gas spills out after closure than prior.
Additionally when energy recovery is added to the mix, the problem is compounded, according to waste-to-energy opponents. "The pro methane-to-energy argument is you are creating electricity from cleaner fuel than from coal, thus reducing emissions. But to get commercial-scale volume and quality you have to leave the top off and recirculate leachate. In doing so you are accelerating gas generation, and degrading gas collection efficiency, so much more methane escapes," said Anderson.
The industry comes to its own defense by saying a good collection system makes a difference, and that landfills control emissions to a degree with intermediary caps on individual cells once they are filled.
Before waste management practices can be fine-tuned, statistics need to be clear
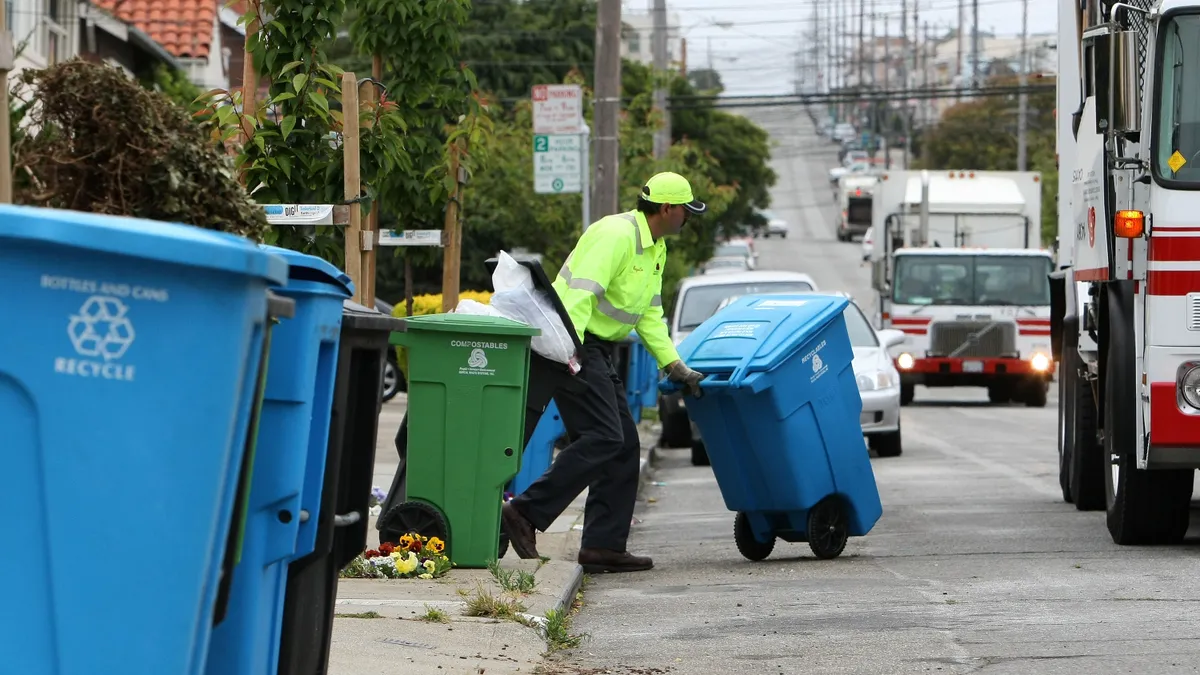
Over 100 North American cities are implementing three-bin waste collection systems to divert the most gas-producing wastes from landfill. One bin is for recyclables, one is for organic waste, and one is for residue (nonrecoverable waste).
In North America, Toronto and San Francisco are leading the way.
"If you go to separate collections, recognize it’s voluntary and not perfect. But there are techniques to make it effective," said Anderson, citing Toronto’s separation strategy, whereby the city collects the organic stream weekly, but collects the residual stream biweekly to discourage people from tossing food in the "residual" bin where it would rot and smell.
“Toronto has achieved over 85% separation of food from residue. But in San Francisco where all bins are collected weekly, meaning noncompliant residents don’t deal with odor, they estimate they will only get 30% of food out. So that shows the power of your collection system as a motivator,” said Anderson.
Energy Justice Network and some other industry leaders suggest banning organic waste from the landfill to digest or compost it instead. Energy Justice suggests collecting gas from existing landfills and filtering its toxins into a solid medium like a carbon filter, to then containerize and store it on-site. Once the gas is purified, it may be fine to burn for steam or electricity.
But before waste management strategies can be fine-tuned, the numbers need to be straight.
"States like Oregon and California are starting to make decisions to determine how to reduce CO2 emissions. This is one area where accurate waste tonnage, coupled with accurate landfill gas emissions, is going to be meaningful. These numbers will have an impact in forming policies. And these policies will guide on-the- ground management and operation decisions moving forward," said Kantner.


